
Visualizing graphs with KeyLines: bringing connected data to life
Everyone knows that there’s value in data. These days, analyzing data to get insights is becoming part of every project’s life cycle. But some might not recognize the value in data connections. The more connections you have in your data, the more value you can find. Visualization can help, says Cambridge Intelligence, and KeyLines – their graph visualization software development kit (SDK) – is here for you.
From data to insights through graph visualization
Most spreadsheets and standard databases are fine if you’re simply calculating basic data aggregations. Analyzing relationships is more difficult. There’s a limit to how much the human brain can process: how many connections can you follow before you lose track? It’s even harder when you’re working with large datasets.
To manage and explore volumes of connected data effectively, you might choose to work with graph databases.
Data in a graph database is modelled in such a way that the connections (or edges) between each data point (or node) are as important as the data itself. But it’s still difficult to analyze such information in its raw, tabular state.
The solution is graph visualization. Being able to see the data brings the nodes and edges to life. With the KeyLines toolkit, you can custom-build your own browser-based visualization application, and start finding the insight you’d otherwise miss.
Visualizing and analyzing graphs with KeyLines
Cambridge Intelligence works with software developers and product managers who want to incorporate powerful and robust graph visualization into their applications. That’s a rapidly-growing market as more and more companies see the value of graphs and data visualization.
One major benefit of KeyLines is that it works with a variety of datasources and back-ends. As long as the data can be parsed into a JSON object, KeyLines can visualize it. Out-of-the-box integrations exist for popular back-ends, such as Neo4j, Titan, ArangoDB, Amazon Neptune, Anzo, and Elastic.
Even if you’re using relational and other databases, or CSV files, KeyLines can handle it. Users can build their own API translating relational or tabular data into a node-link format, which then gets passed to KeyLines as a JSON object.
KeyLines is written in JavaScript, to give users the benefit of web-deployment. JavaScript is one of the most popular and fast-growing coding languages, thanks to its performance and universal support.
Developers use the KeyLines API library to build their application using their prefered method. KeyLines has components for the most popular JavaScript frameworks including Angular, React and Vue. Developers can also write their KeyLines application in TypeScript, taking advantage of intellisense, compile-time type checking and context-sensitive API documentation.
Buy or build?
As an SDK, KeyLines gives users the flexibility to build something custom, without the considerable time and resources it would take to create it from scratch.
Although there are some open source solutions that developers can also use for graph visualization, Cambridge Intelligence says customers prefer KeyLines for a few different reasons:
1) The security and support that comes with a commercial product like KeyLines. The support team is made up of core KeyLines developers, so if a customer has a question, they’ll get a fast response from an expert.
2) The developer experience. A lot of time has been spent on documentation, database and framework integrations, and general developer experience. There are over 80 fully-tested demos complete with code examples to save you coding from scratch – making it faster and easier to get started and build something great.
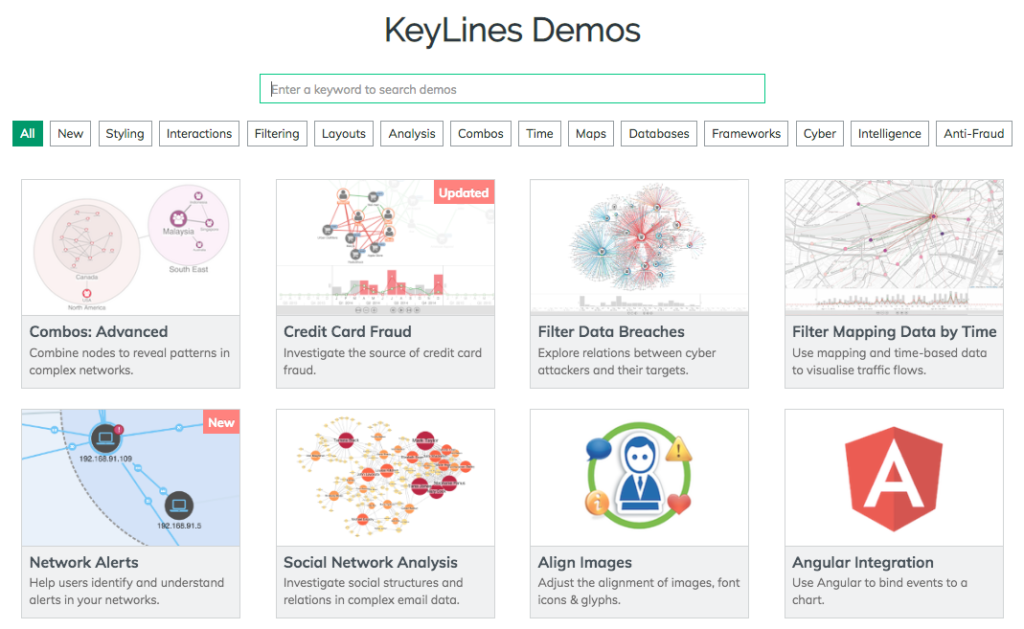
Download code for over 80 feature-rich KeyLines demos.
3) Functionality and performance. The development team are constantly making KeyLines better, and they release a new version every month. Over the years, KeyLines has achieved great visualization performance and quality, using modern web technologies like WebGL. Carefully optimized graph algorithms mean it can handle bigger graphs more easily. It also contains advanced and unique functionality. Let’s explore this in more detail.
Advanced KeyLines functionality
Besides standard graph visualization, which is no easy feat by the way, it’s worth expanding a bit on the advanced features that KeyLines offers: combos, time bar, graph algorithms, and geospatial visualization.
Combos – advanced node grouping
When the volume and complexity of data being visualized explodes, the result is overloaded charts and overwhelmed analysts. KeyLines provides a solution with combos.
Combos are visual groupings of nodes and links, which can be styled, opened, closed, nested and moved around. This is an intuitive and powerful way to explore your most complex networks.

Combining nodes that have something in common declutters complex KeyLines charts.
Time bar – explore dynamic networks
Data tends to evolve over time, and KeyLines helps you visualize that. Using the time bar, you can instantly filter data by date and time to see how networks evolve, and investigate network and subnetwork trends. The time bar can be deployed as a standalone component or be fully integrated into your main KeyLines node-link chart.
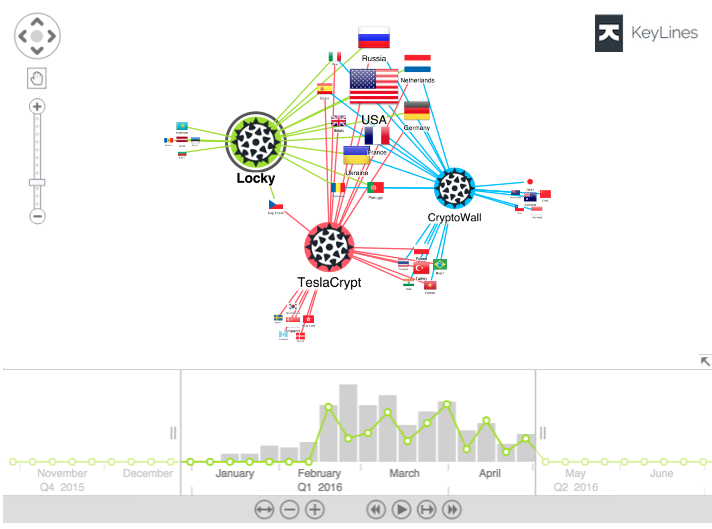
KeyLines can filter data by time and show trend lines to reveal patterns.
Social Network Analysis – finding important nodes
Graph algorithms such as PageRank, Betweenness or Centrality are useful for understanding the relative importance of different actors in a network. They can be used in Social Network Analysis and beyond, to visualize flow of information and influence. Performing these calculations ‘on the fly’ in the front end instead of in your database, gives your users more flexibility.
Geospatial – advanced mapping analysis
Last but not least, as long as your graph data has a location property (latitude and longitude), with KeyLines you can view your network data on a map, and transition seamlessly from a network view to a map view. Maps can also be integrated with any other KeyLines functionality.
The past, present and future of graph visualization with KeyLines
KeyLines has a new major release, 5.0, scheduled before the end of this year. The focus is on new and improved geospatial features, reinforcing the message that geospatial analysis is an important way to find insight in graph data.
Key to the 5.0 release is the ability to use an image as a map (think floorplans of prisons or airports), and maps as dashboards (think drilling into a map to reveal network detail on demand). Support for a new Coordinate Reference Systems (CRS) option will be added, so users can choose whichever map tile provider they prefer (e.g., ESRI).

Using the new CRS options in KeyLines 5 to overlay data.
This airport diagram from www.airportshuttles.com shows the volume of flight connections involving a transfer between terminals.
Cambridge Intelligence was founded in 2011 by Dr Joe Parry, to build visualization tools that make the world safer. Back then, the tools for visualizing connected data were inflexible, bafflingly complex and limited to the desktop. Graph analysis and visualization was really only used by highly trained analysts for law enforcement and fraud-related use cases. So Joe set out to reinvent connected data visualization to work for everyone.

Dr Joe Parry, founder and CEO of Cambridge Intelligence.
It wasn’t long before Joe built a team and released v1.0 of KeyLines in 2012.
As we’ve seen, KeyLines brought advanced graph visualization to a wider audience. Based on modern web technology, it’s scalable across teams and devices. Its toolkit approach means each deployment is custom designed for the data, the user, and the questions they’re trying to answer.
A big driver of KeyLines’ success has been the explosion of interest in graph databases, making more people think in terms of graphs. Often, the next step is to visualize those graphs. KeyLines, however, was designed to be database ‘agnostic’ and work with all technologies.
Cambridge Intelligence will continue to improve KeyLines and extend its product set, working on its vision to build the world’s best visualization software that reveals threats and insights in connected data.
If you want to know try KeyLines for yourself, visit their site to request a free trial. To see KeyLines in action, drop by Connected Data London on November 7th 2018, where Dan Williams, KeyLines product manager, will explore Graphs in space, sharing a guide to visualizing geospatial networks.
This is what Connected Data London 2018 brought to the fore. Connected Data London 2019 is on! Secure your chance to learn from experts and innovators, get your ticket early! Limited number early bird tickets available.